peaks
- class timeflux_dsp.nodes.peaks.LocalDetect(delta, tol, reset=None)[source]
Bases:
timeflux.core.node.NodeDetect peaks and valleys in live 1D signal
This node uses a simple algorithm to detect peaks in real time. When a local extrema (peak or valley) is detected, an event is sent with the nature specified in the label column (
peak/valley) andcthe characteristics in the data column, giving:value: Amplitude of the extrema.
lag: Time laps between the extrema and its detection.
interval: Duration between two extrema os same nature.
- Variables
i (Port) – Default input, expects DataFrame.
o (Port) – Events output, provides DataFrame.
- Parameters
delta (float) – Threshold for peak/valley matching in amplitude. This can be seen as the minimum significant change enough to detect a peak/valley.
tol (float) – Tolerence for peak/valley matching, in seconds. This can be seen as the minimum time difference between two peaks/valleys.
reset (float) – Reset threshold, in seconds. This can be seen as the maximum duration of plausible transitions between peaks and valleys. Default: None.
Example
graphs:

  - id: example
    nodes:
    - id: random
      module: timeflux.nodes.random
      class: Random

    - id: droprows
      module: timeflux_dsp.nodes.filters
      class: DropRows
      params:
        factor: 2

    - id: display
      module: timeflux.nodes.debug
      class: Display
    edges:
    - source: random
      target: droprows
    - source: droprows
      target: display
    rate: 10
Example
In this example, we stream a photoplethysmogram signal scaled between -1 and 1 and we use the node RealTimeDetect to detect peaks and valleys.
delta= 0.1tol= 0.5reset= None

self.o.data:
                                label                                               data
2018-11-19 11:06:39.620900000    peak  {'value': [1.0054607391357422], 'lag': 0.03125, 'interval': 0.654236268}
2018-11-19 11:06:39.794709043  valley  {'value': [-1.0110111236572266], 'lag': 0.046875, 'interval': 0.654236268}
2018-11-19 11:06:40.605209027    peak  {'value': [0.9566234350204468],  'lag': 0.033197539, 'interval': 0.984309027}
2018-11-19 11:06:40.761455675  valley  {'value': [-1.0549353361129759], 'lag': 0.048816963, 'interval': 0.810499984}
Notes
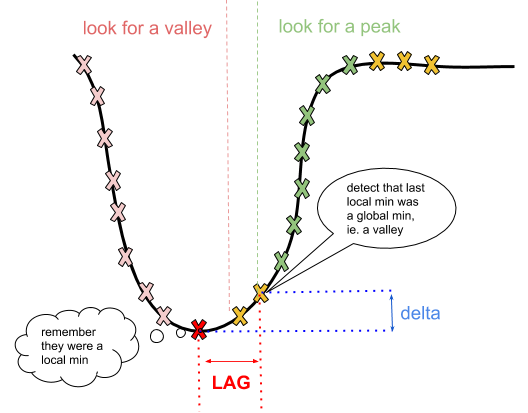
This peak detection is considered real-time since it does not require buffering the data. However, the detection method necessarily involve a lag between the actual peak and its detection. Indeed, the internal state of the node is either “looking for a peak” or “looking for a valley”.
- If the node is “looking for a peak”, it means it computes local maxima
until the signal drops significantly (ie. more than
delta)
- If the node is “looking for a valley”, it means it computes local minima
until the signal rises significantly (ie. more than
delta)
The “last local extrema” is set to a peak (resp. valley) as soon as the signal drops (resp. rises) significantly. Hence, there is an intrinsic lag in the detection, that is directly linked to parameter
delta.Hence, by decreasing delta, we minimize the lag. But if delta is too small, we’ll suffer from false positive detection, unless
tolis tuned to avoid too closed detections. The parameters should be tuned depending on the nature of the data, ie. their dynamic, quality, shapes.See the illustration above:
References
Todo
allow for adaptive parametrization.
Instantiate the node.
- class timeflux_dsp.nodes.peaks.RollingDetect(length: object = 0.5, tol: object = 0.1, rate: object = None)[source]
Bases:
timeflux.core.node.NodeDetect peaks and valleys on a rolling window of analysis in 1D signal This node uses a buffer to compute local extrema and detect peaks in real time. When a local extrema (peak or valley) is detected, an event is sent with the nature specified in the label column (“peak”/”valley) and the characteristics in the data column, giving:
value: Amplitude of the extrema.
lag: Time laps between the extrema and its detection.
interval: Duration between two extrema os same nature.
- Parameters
- Variables
i (Port) – Default input, expects DataFrame.
o (Port) – Events output, provides DataFrame.
Instantiate the node.
- class timeflux_dsp.nodes.peaks.Rate(event_trigger='peak', event_label='label')[source]
Bases:
timeflux.core.node.NodeComputes rate of an event given its label.
This node computes the inverse duration (ie. instantaneous rate) between onsets of successive events with a marker matching the
event_triggerin theevent_labelcolumn of the event input,- Variables
i (Port) – Default input, expects DataFrame.
o (Port) – Default output, provides DataFrame.
- Parameters
event_trigger (string) – The marker name.
event_label (string) – The column to match for event_trigger.
Instantiate the node.